Plot data
nPDyn provides a plot window for quasi-elastic neutron scattering (QENS) and elastic/inelastic fixed-window scans (E/IFWS) data.
It can be used as follows:
>>> from nPDyn.plot import plot
>>> plot(sample)
Using the result of the fitting procedure presented in the Fit data section, the data, the fitted model model and the parameters can be examined using the window as shown below:
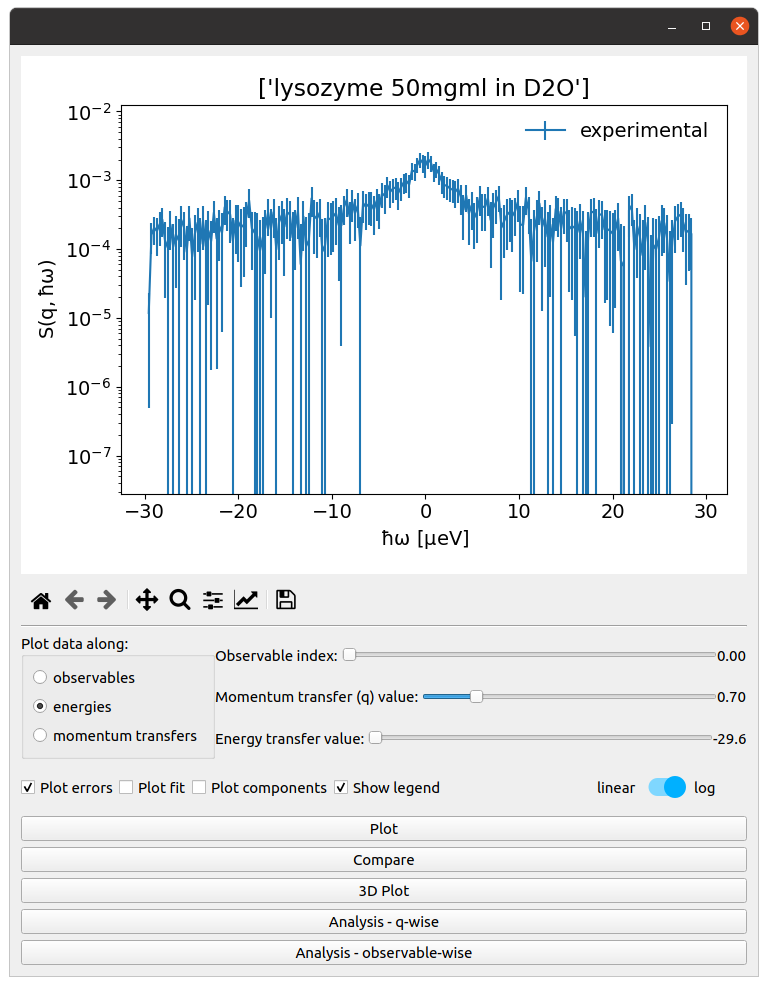
The experimental data are plotted alone with their errors for the selected observable and momentum transfer q value.

Here, the fitted model and its components are added by clicking on the associated checkboxes.

An 3D view of all spectra is available by clicking on the ‘3D plot’ button.

The optimized parameters can be plotted by clicking on the ‘Analysis’ button. The global parameters (which are unique for all q-values) are represented by a single horizontal line.

The data are plotted along the momentum-transfer q-values. The fitted model, which is used to extract the mean-squared displacement is added.

The whole dataset can be plotted using the ‘3D plot’ button.

The optimized parameters can be plotted along different axis (observable, energy, q-values). Here, the uncertainty on the parameters is represented by the blue shaded area around the curve.